Introduction
Elasticsearch and Kibana are powerful tools that form the core of what’s called the ELK Stack (Elasticsearch, Logstash, Kibana). Elasticsearch is a distributed search and analytics engine, while Kibana is the visualization layer that makes all your data beautiful and actionable.
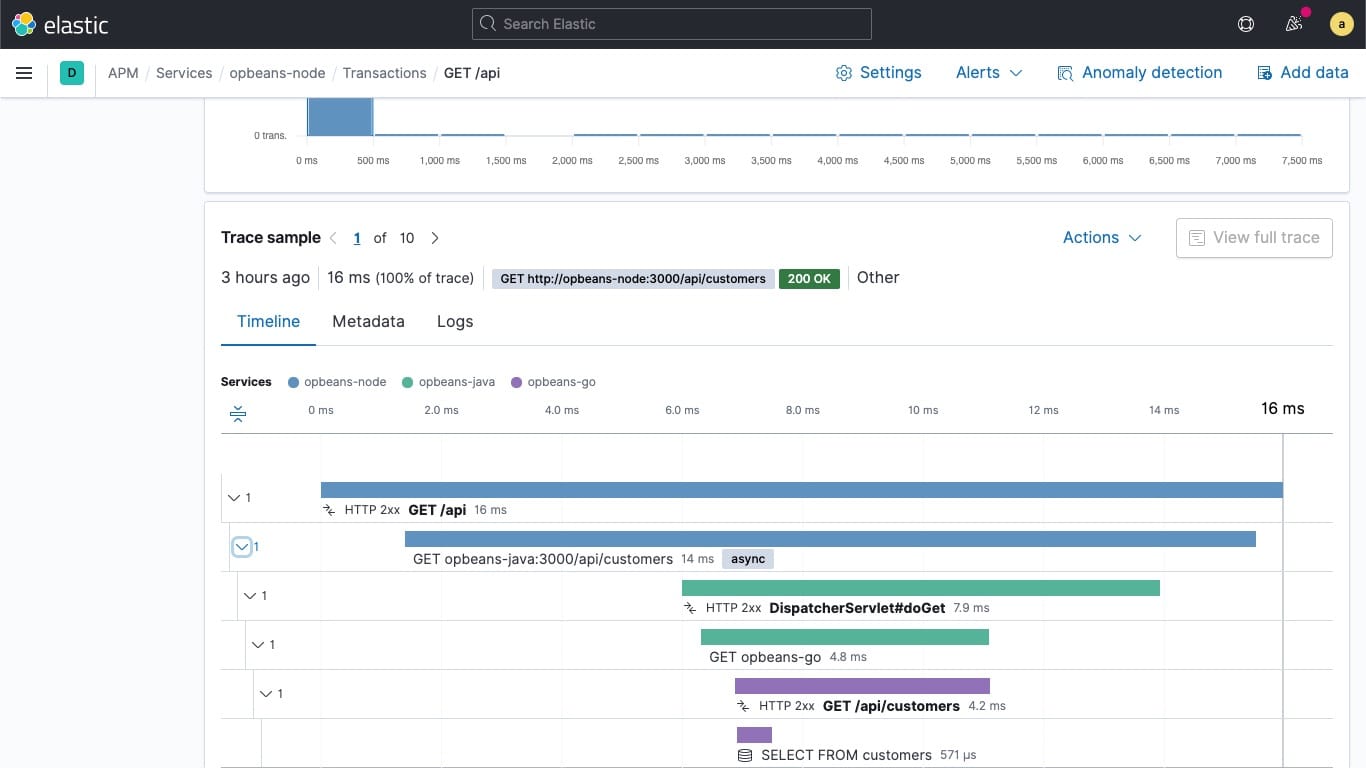
What really got me excited about this setup is the APM (Application Performance Monitoring) capabilities. It’s absolutely best-in-class tool for monitoring your applications – you can track performance metrics, errors, logs, and get real-time insights into what’s happening in your infrastructure. Of course, to achieve this we need to integrate Elastic APM in our stack, but more on that in future articles – first we need to start with the basics.
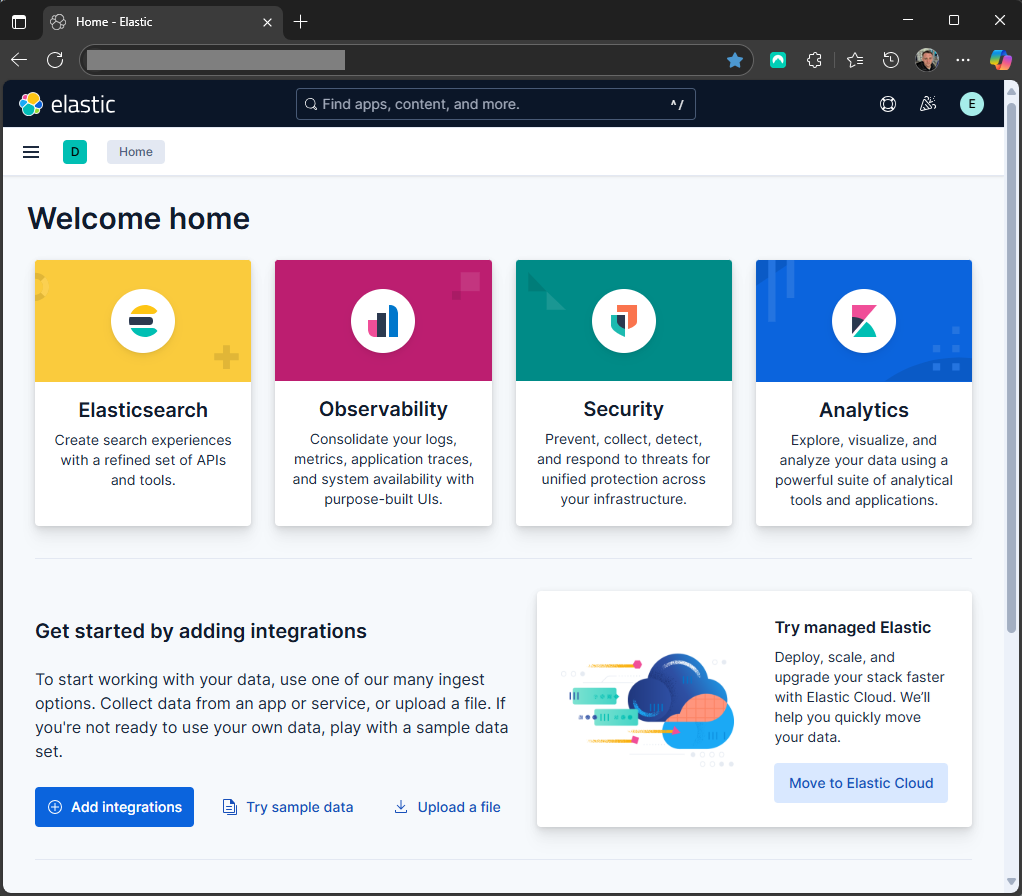
In this tutorial, I’ll walk you through installing both Elasticsearch and Kibana on your own VPS with proper SSL certificates, domain configuration (like kibana.yoursite.com), and even CrowdSec integration for security. This is the first article in my Elastic Stack series, so expect more tutorials in this topic.
Now, let’s be realistic here – this isn’t a super production-ready setup for enterprise use, but for local testing, collecting logs from smaller applications, or learning purposes, it’s perfect – we can rent for this purpose small VM on Hetzner only for for ~8 EUR/month.
I recommend having at least 8GB of RAM on your VPS, and it works on both AMD64 and ARM64 architectures. I’ll be doing this on Ubuntu.
We’ll be following the official guides from Elastic, but I’m giving you the “extended package” with all the bells and whistles:
VPS Configuration
Before we start, you should perform basic hardening of your VPS. I haven’t written a comprehensive article about server hardening yet (definitely on my todo list), but you should at least configure swap, secure SSH access, configure a firewall, and follow basic security practices. I’ll assume you have a clean Ubuntu server with root access.
Installing Elasticsearch
System Updates
First things first – let’s get everything up to date:
apt updateAdding the Elastic Repository
Now we need to add the official Elastic repository to our system. This ensures we get the latest stable versions and security updates:
wget -qO - https://artifacts.elastic.co/GPG-KEY-elasticsearch | sudo gpg --dearmor -o /usr/share/keyrings/elasticsearch-keyring.gpg

apt install apt-transport-https -y

echo "deb [signed-by=/usr/share/keyrings/elasticsearch-keyring.gpg] https://artifacts.elastic.co/packages/9.x/apt stable main" | sudo tee /etc/apt/sources.list.d/elastic-9.x.list

apt updateInstalling Elasticsearch
With the repository configured, installing Elasticsearch is straightforward:
apt install elasticsearch -yInitial Configuration
Now comes the important part – configuring Elasticsearch. I’m going to explain why we’re making these changes:
nano /etc/elasticsearch/elasticsearch.ymlAdd or modify these settings:
cluster.name: my-cluster
network.host: 0.0.0.0
http.port: 9200
transport.host: 0.0.0.0Important note: I’m using 0.0.0.0 temporarily to make configuration easier. Later, we’ll lock this down to 127.0.0.1 when we set up our reverse proxy with SSL and domain configuration. This is much more secure.
[Optional] Storage Configuration
Here’s something that many tutorials skip – configuring dedicated storage for Elasticsearch data. If you have a separate disk or partition for data (which I highly recommend), configure it now:
nano /etc/elasticsearch/elasticsearch.ymlAdd these paths:
path.data: /mnt/disk1/elasticsearch/data
path.logs: /mnt/disk1/elasticsearch/logsWhy separate storage? Elasticsearch can generate a lot of data and logs. Having dedicated storage prevents your system from running out of space and allows for better performance and backup strategies.
Starting Elasticsearch
Let’s enable and start the service:
sudo systemctl daemon-reload
sudo systemctl enable elasticsearch.service
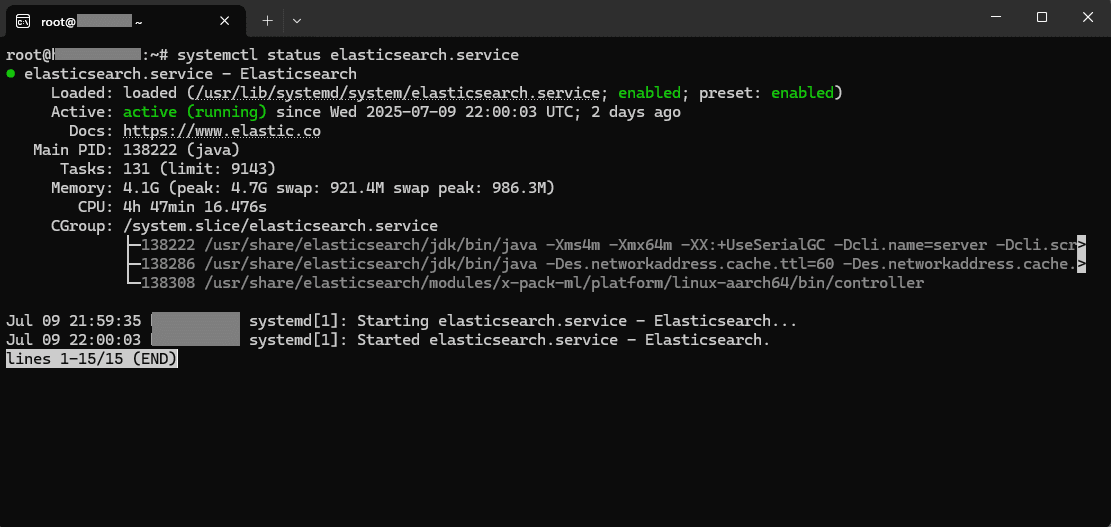
sudo systemctl start elasticsearch.serviceAnd check if it’s running:
sudo systemctl status elasticsearch.serviceConfiguring Elasticsearch
Setting Up Authentication
Elasticsearch comes with security features enabled by default. We need to set up the password for the elastic superuser:
/usr/share/elasticsearch/bin/elasticsearch-reset-password -u elasticSave this password! This is your root access to Elasticsearch, and you’ll need it for Kibana configuration.
Testing the Installation
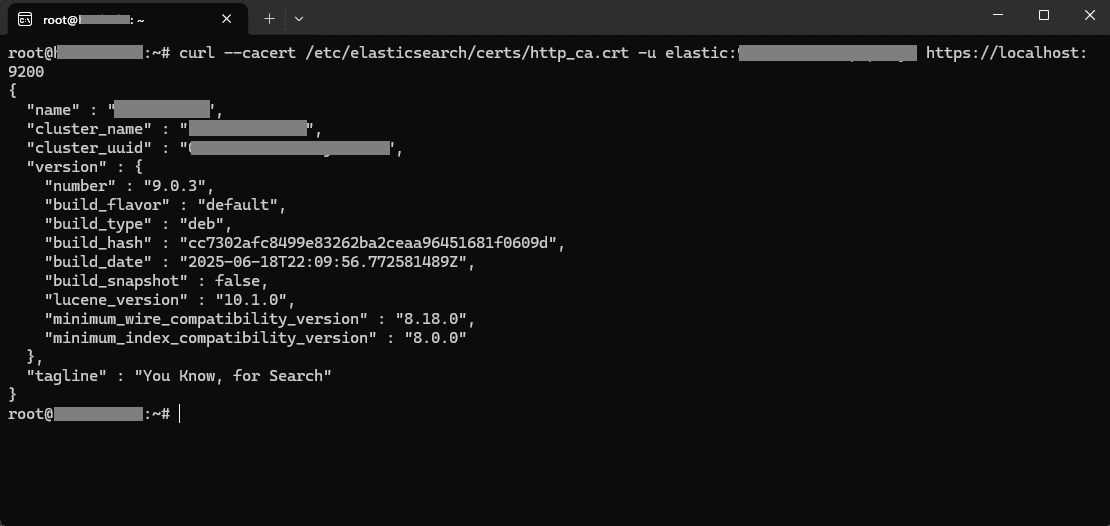
Let’s verify everything is working:
curl --cacert /etc/elasticsearch/certs/http_ca.crt -u elastic:<your-password> https://localhost:9200You should see a JSON response with cluster information.
Installing Kibana
With Elasticsearch running, let’s install Kibana:
apt install kibana -yKibana Configuration
Now we need to configure Kibana to work with our Elasticsearch instance:
nano /etc/kibana/kibana.ymlConfigure these settings:
server.port: 5601
server.host: 0.0.0.0Again, 0.0.0.0 is temporary – we’ll secure this later with our reverse proxy setup.
Starting Kibana
Enable and start the Kibana service:
sudo systemctl daemon-reload
sudo systemctl enable kibana.service
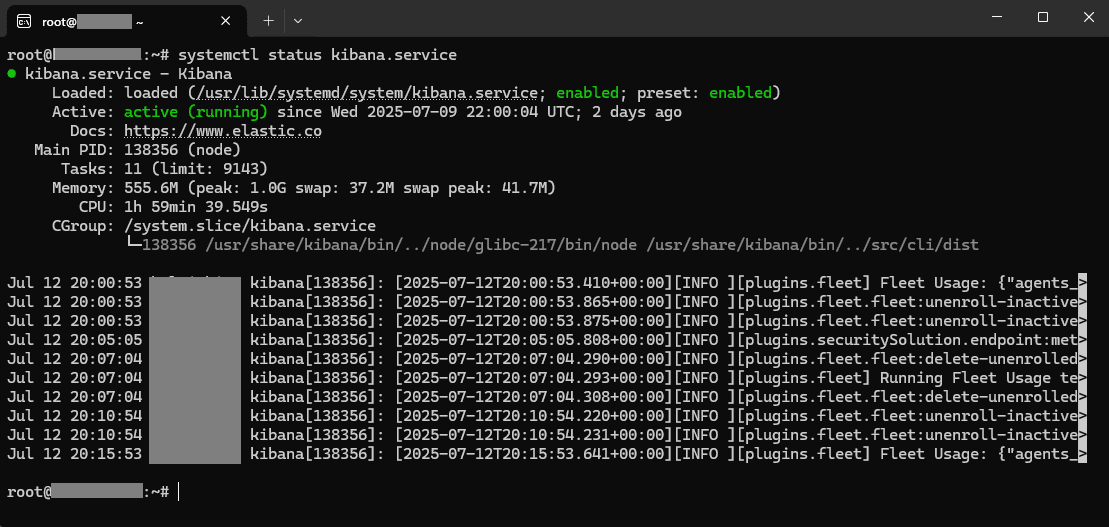
sudo systemctl start kibana.serviceAnd check if it’s running:
sudo systemctl status kibana.serviceConfiguring Kibana
Connecting to Elasticsearch
Kibana needs to connect to Elasticsearch. We’ll generate an enrollment token:
/usr/share/elasticsearch/bin/elasticsearch-create-enrollment-token -s kibanaInitial Setup
Now navigate to http://your-server-ip:5601 in your browser. You’ll be prompted to enter the enrollment token we just generated. After that, log in with the elastic user and the password we set earlier.
Encryption Keys
Kibana needs encryption keys for various features like uptime monitoring. Without these, you’ll see errors in the logs:
/usr/share/kibana/bin/kibana-encryption-keys generateCopy the generated settings (they look like xpack.encryptedSavedObjects.encryptionKey: ...) and add them to your Kibana configuration:
nano /etc/kibana/kibana.ymlPaste the generated keys, then restart Kibana:
sudo systemctl restart kibana.serviceDomain and SSL Configuration
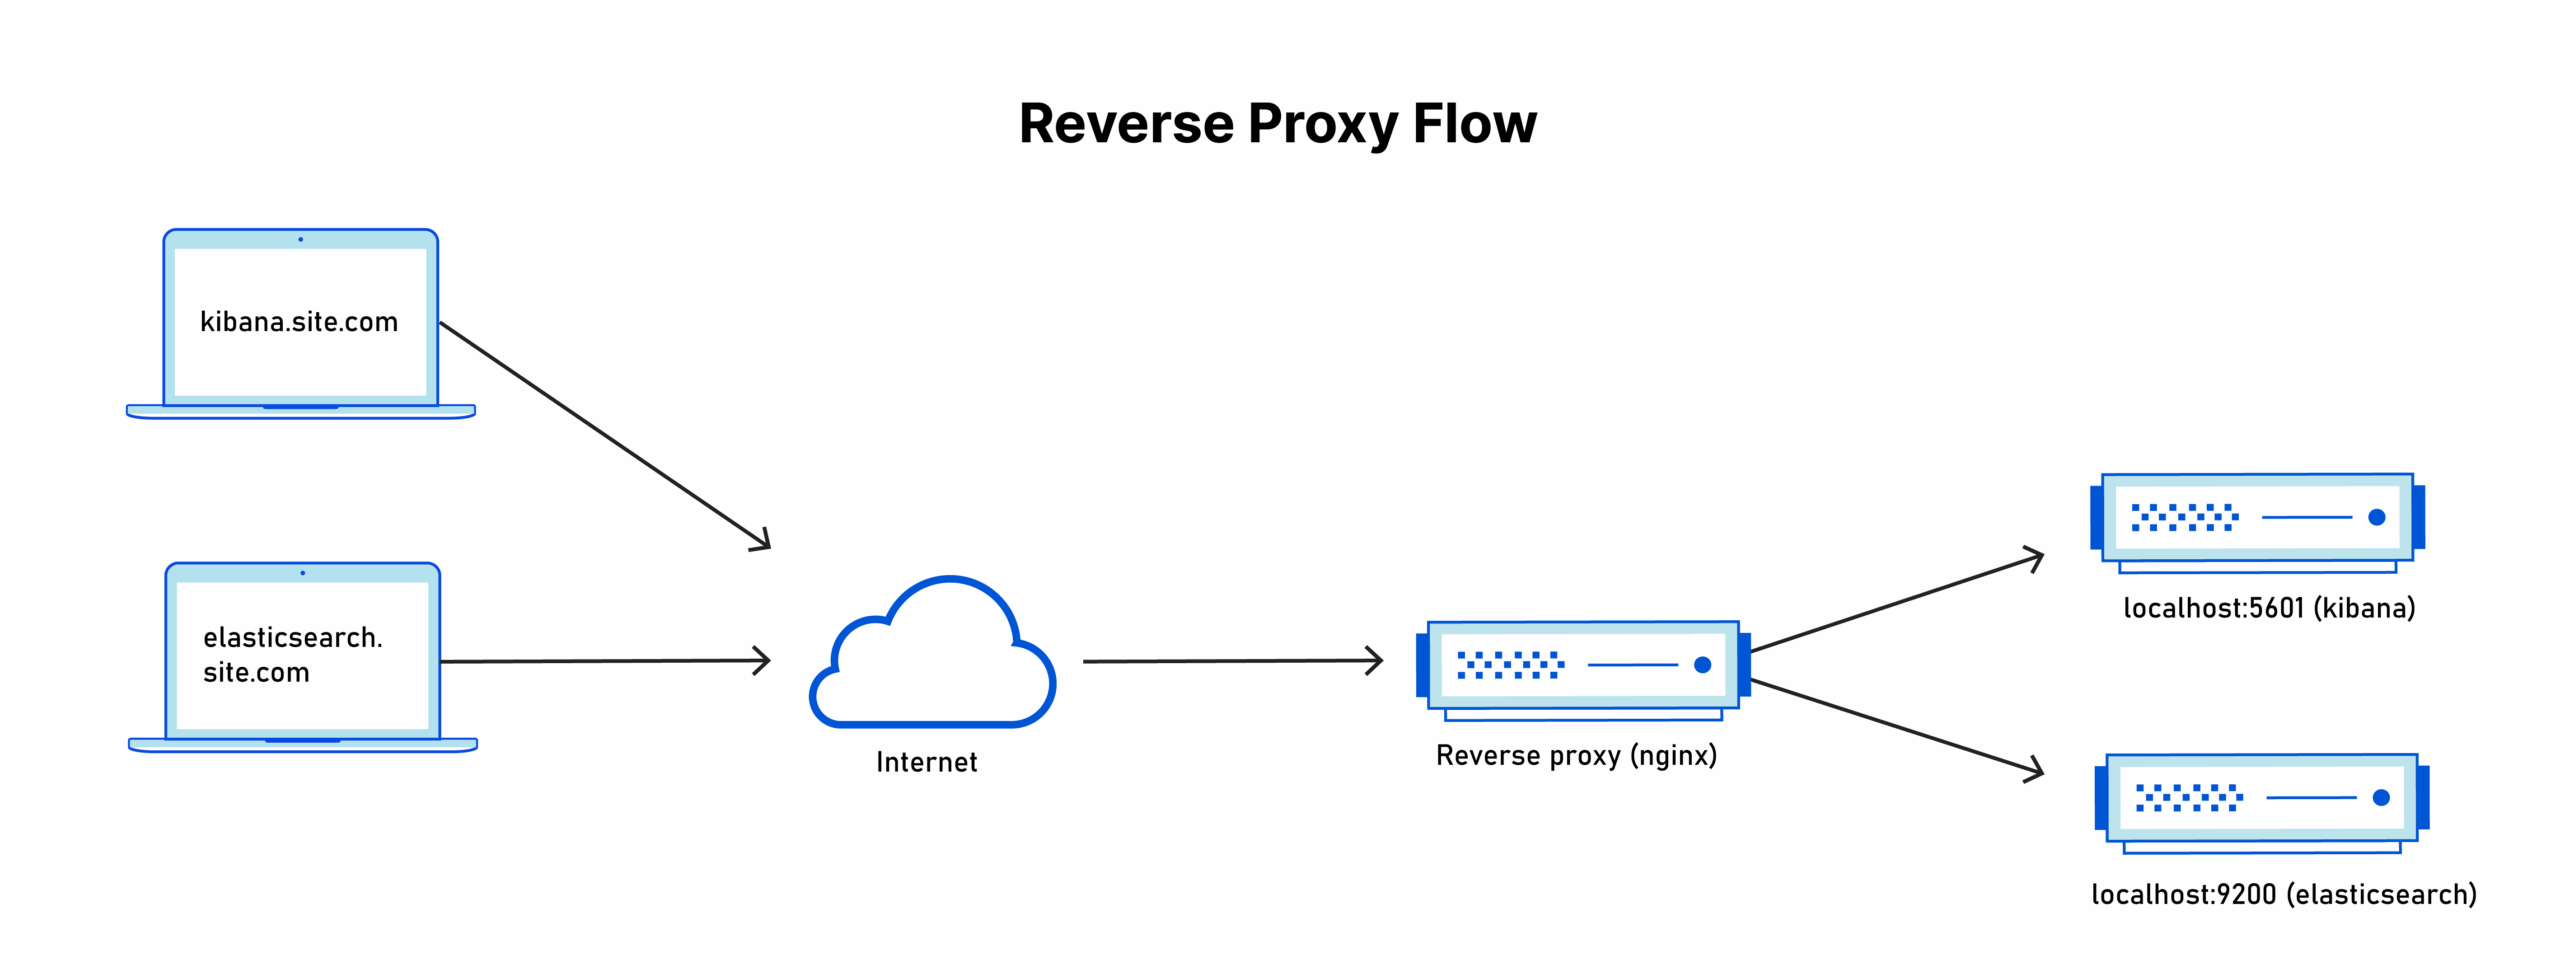
Now we’re getting to the fun part – setting up proper domains and SSL certificates. I’ll be using domains like elasticsearch.yoursite.com and kibana.yoursite.com.
First, you need to add A/AAAA records to your DNS pointing to your server’s IP address. How you do this depends on your DNS provider, but the concept is the same everywhere.
Temporary SSL Certificate
We need a temporary certificate for nginx configuration. Don’t worry, we’ll replace this with a proper Let’s Encrypt certificate later:
openssl req -x509 -nodes -days 3 -newkey rsa:2048 \
    -keyout /etc/ssl/private/temporary-cert-for-nginx.key \
    -out /etc/ssl/certs/temporary-cert-for-nginx.crt \
-subj "/CN=kibana.yoursite.com"Installing Certbot
Certbot is Let’s Encrypt’s official tool for obtaining SSL certificates:
apt install snapd
snap install --classic certbot
ln -s /snap/bin/certbot /usr/bin/certbotInstalling Nginx
We’ll use Nginx as a reverse proxy. This gives us SSL termination, better security, and the ability to use custom domains:
apt install nginx -yKibana Reverse Proxy Configuration
Create the Nginx configuration for Kibana:
nano /etc/nginx/sites-available/kibanaserver {
listen 443 ssl http2;
server_name kibana.yoursite.com; # Change this to your domain
# SSL certificate (certbot will replace these automatically)
ssl_certificate /etc/ssl/certs/temporary-cert-for-nginx.crt;
ssl_certificate_key /etc/ssl/private/temporary-cert-for-nginx.key;
# Basic SSL settings
ssl_protocols TLSv1.2 TLSv1.3;
ssl_ciphers HIGH:!aNULL:!MD5;
# Logging for CrowdSec
access_log /var/log/nginx/kibana-access.log;
error_log /var/log/nginx/kibana-error.log;
location / {
proxy_pass http://127.0.0.1:5601;
proxy_set_header Host $host;
proxy_set_header X-Real-IP $remote_addr;
proxy_set_header X-Forwarded-For $proxy_add_x_forwarded_for;
proxy_set_header X-Forwarded-Proto $scheme;
proxy_http_version 1.1;
proxy_set_header Upgrade $http_upgrade;
proxy_set_header Connection 'upgrade';
proxy_cache_bypass $http_upgrade;
}
}Enable the configuration:
ln -s /etc/nginx/sites-available/kibana /etc/nginx/sites-enabled/kibana
nginx -tElasticsearch Reverse Proxy Configuration
Create the Nginx configuration for Elasticsearch:
nano /etc/nginx/sites-available/elasticsearchserver {
listen 443 ssl http2;
server_name elasticsearch.yoursite.com; # Change this to your domain
# Basic SSL settings
ssl_protocols TLSv1.2 TLSv1.3;
ssl_ciphers HIGH:!aNULL:!MD5;
# SSL certificate (certbot will replace these automatically)
ssl_certificate /etc/ssl/certs/temporary-cert-for-nginx.crt;
ssl_certificate_key /etc/ssl/private/temporary-cert-for-nginx.key;
# Logging for CrowdSec
access_log /var/log/nginx/elasticsearch-access.log;
error_log /var/log/nginx/elasticsearch-error.log;
# Security headers
add_header X-Frame-Options DENY;
add_header X-Content-Type-Options nosniff;
add_header X-XSS-Protection "1; mode=block";
location / {
proxy_pass https://127.0.0.1:9200;
proxy_http_version 1.1;
proxy_set_header Host $host;
proxy_set_header X-Real-IP $remote_addr;
proxy_set_header X-Forwarded-For $proxy_add_x_forwarded_for;
proxy_set_header X-Forwarded-Proto $scheme;
proxy_set_header Connection "";
# SSL off because we're connecting to ES via HTTPS with self-signed cert
proxy_ssl_verify off;
proxy_ssl_session_reuse on;
# Timeouts for long queries
proxy_connect_timeout 60s;
proxy_send_timeout 60s;
proxy_read_timeout 60s;
# Buffer settings
proxy_buffering on;
proxy_buffer_size 128k;
proxy_buffers 4 256k;
proxy_busy_buffers_size 256k;
}
# Health check endpoint
location /_health {
proxy_pass https://127.0.0.1:9200/_cluster/health;
proxy_ssl_verify off;
proxy_ssl_session_reuse on;
access_log off;
}
}Enable this configuration too:
ln -s /etc/nginx/sites-available/elasticsearch /etc/nginx/sites-enabled/elasticsearch
nginx -tRestart Nginx
systemctl restart nginxGenerating SSL Certificates
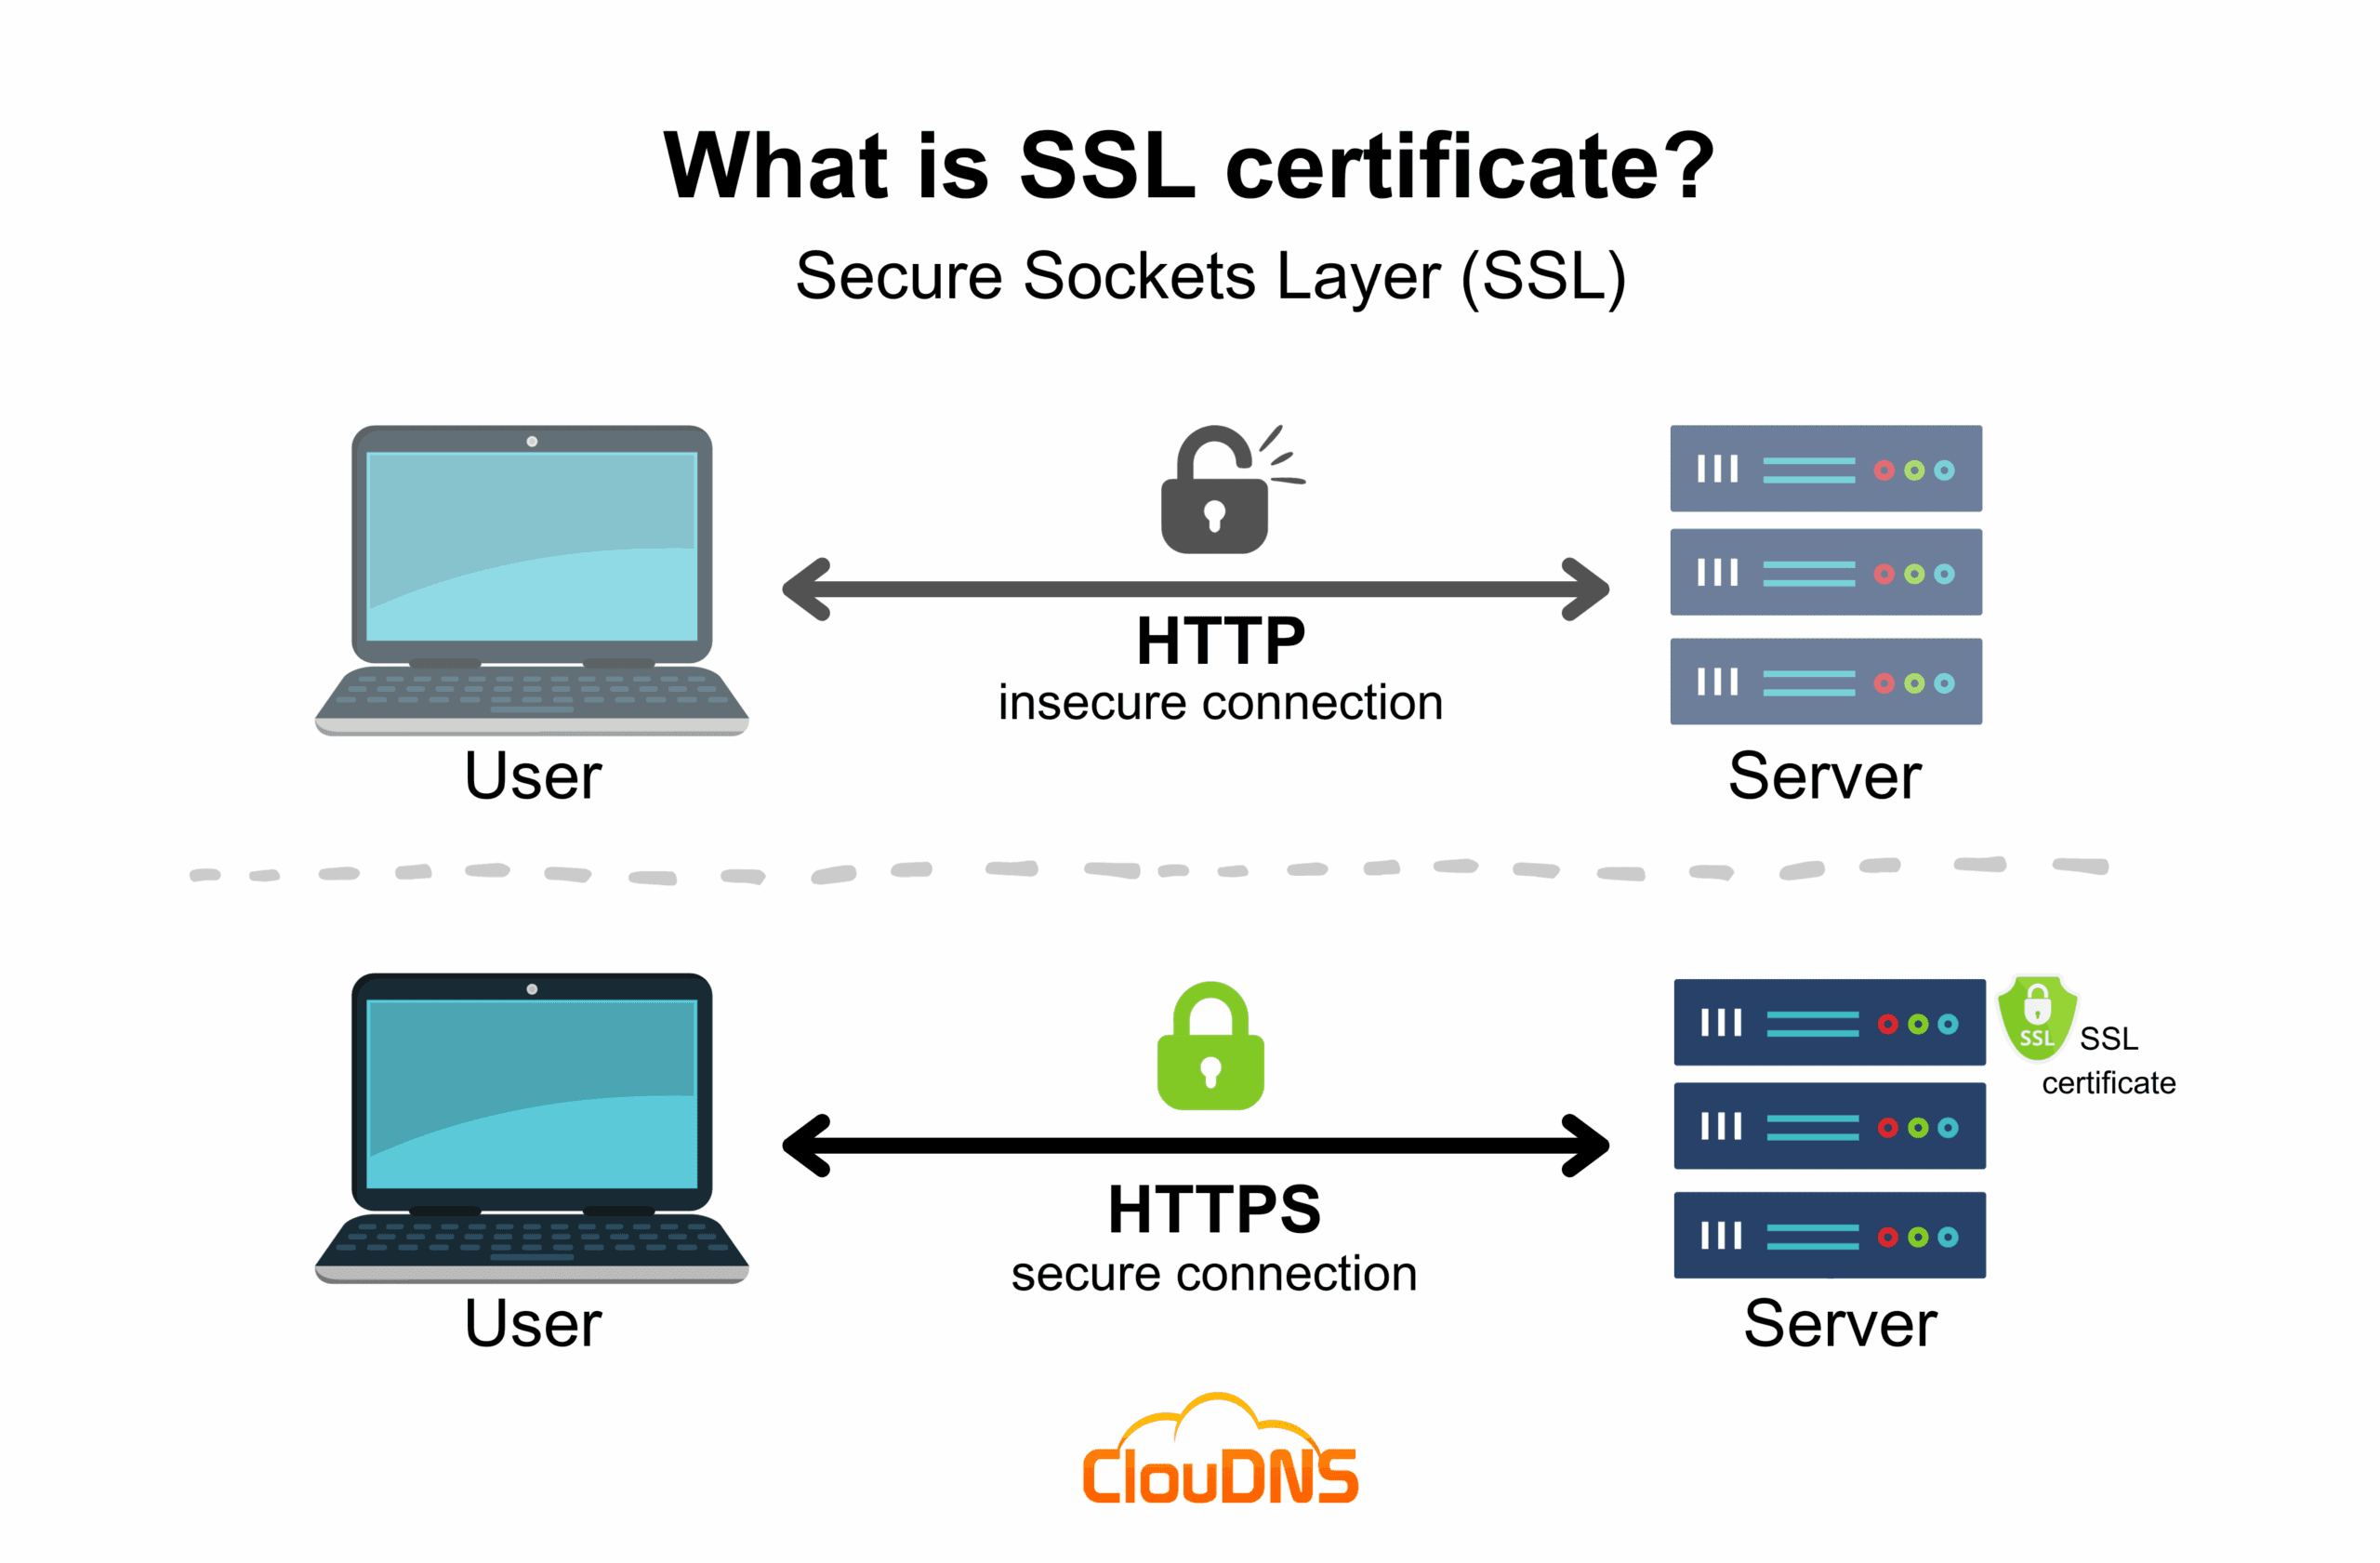
Now for the magic – let’s get proper SSL certificates from Let’s Encrypt:
certbot --nginxCertbot will automatically detect your Nginx configurations and offer to secure them. Select both domains and follow the prompts.
systemctl restart nginxTesting
Navigate to https://kibana.yoursite.com – you should see Kibana with a proper SSL certificate!
Securing the Installation
Now that we have our reverse proxy working, let’s lock down access to localhost only.
Restricting Elasticsearch Access
Change the network settings:
nano /etc/elasticsearch/elasticsearch.ymlnetwork.host: 127.0.0.1
http.host: 127.0.0.1And restart elasticsearch
systemctl restart elasticsearchRestricting Kibana Access
Update these settings:
nano /etc/kibana/kibana.ymlserver.host: 127.0.0.1
server.publicBaseUrl: "https://kibana.yoursite.com"
elasticsearch.hosts: ["https://127.0.0.1:9200"]And restart kibana
systemctl restart kibanaVerify that Kibana is still accessible through your domain.
Free bonus content!
If you want to get my script for automatically patching such a server with Elastic stack for free, sign up for my newsletter!
I wrote this script to make it quick and just one click away. After signing up, you’ll receive a link to the bonus section of my articles.
Thanks!
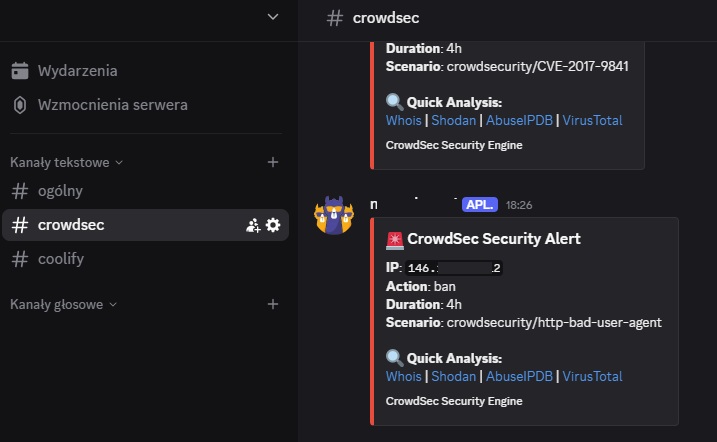
CrowdSec Integration
I’ve already covered CrowdSec installation in detail in my previous articles:
Important: Go directly to the “Bonus” section and start from step 4 in the article.
After setting up CrowdSec, make sure to add our Elasticsearch and Kibana logs to the acquisition configuration:
nano /etc/crowdsec/acquis.yamlAdd these log files:
filenames:
  - /var/log/nginx/kibana-access.log
  - /var/log/nginx/kibana-error.log
  - /var/log/nginx/elasticsearch-access.log
  - /var/log/nginx/elasticsearch-error.log
labels:
type: nginxBonus: Restricting access to Kibana
Alright, but you could ask: “Exposing Kibana to the public internet like this isn’t very secure, is it?” Correct, and there’s an interesting solution for that. We can configure the NGINX reverse proxy to block all traffic and allow only connections from our IP address – you can do the same in other services (if you don’t have a static IP, you can set proper routing on hosts file on your PC and use Tailscale).
To do this, add to file nano /etc/nginx/sites-available/kibana:
    location / {
        allow 100.64.0.10; # <-- Your PC IP address
deny all; # <---TIP: You can also use IP range:allow 100.64.0.0/10;allow aa7a:bb5c:cce0::/48;
and create two hooks for certbot: sudo nano /etc/letsencrypt/renewal-hooks/pre/nginx-unlock.sh
#!/bin/bash
echo "Temporarily removing IP restrictions from NGINX..."
sed -i 's/^\s*allow .*;.*$/# \0/g' /etc/nginx/sites-available/kibana
sed -i 's/^\s*deny all;.*$/# \0/g' /etc/nginx/sites-available/kibana
nginx -t && systemctl reload nginx
and sudo nano /etc/letsencrypt/renewal-hooks/post/nginx-lock.sh:
#!/bin/bash
echo "Restoring IP restrictions in NGINX..."
sed -i 's/^#\s*\(allow .*;\)$/\1/g' /etc/nginx/sites-available/kibana
sed -i 's/^#\s*\(deny all;\)$/\1/g' /etc/nginx/sites-available/kibana
nginx -t && systemctl reload nginxFinally, fix the permissions:
chmod +x /etc/letsencrypt/renewal-hooks/pre/nginx-unlock.sh
chmod +x /etc/letsencrypt/renewal-hooks/post/nginx-lock.shConclusion
Congratulations! You now have a fully functional Elasticsearch and Kibana setup with proper SSL certificates, domain configuration, and security measures in place. This setup gives you:
- Elasticsearch accessible at
https://elasticsearch.yoursite.com - Kibana accessible at
https://kibana.yoursite.com - SSL certificates automatically renewed by Let’s Encrypt
- Security through CrowdSec integration
- Proper access control with services bound to localhost
Remember to keep your system updated, monitor your resource usage (especially RAM and disk space), and regularly back up your Elasticsearch data. The configuration files we created are also worth backing up.
Happy monitoring!


